8.3/10
Deal ScoreCard

4411 Lowell Blvd, Denver, CO 80211

$612,000 For sale · 9 days
4 bd 2 ba 1,890 sqft Built 1925
Zillow
Note from sender
Numbers assume 30% down at 6.5%. Rents are RentCast estimates cross-checked against active listings.
Why this property

The one to buy if you plan to live in it. Strongest street of the three, strongest appreciation story, and the basement apartment pays most of the mortgage. Move fast; it will not last the weekend.

Key Numbers

Long-term rental, at the assumptions below

Cap rate
5.84%
Cash-on-cash
1.62%
Monthly costs
$3,123/mo
mortgage, tax, insurance, HOA
Cash to close
$201,960
down payment + closing
DSCR
1.10x
NOI ÷ debt service
Break-even occupancy
89%
to cover costs + mortgage
Debt yield
8.3%
NOI ÷ loan
GRM
11.6x
price ÷ gross annual rent
Rent-to-value
0.72%
the 1% rule
Equity multiple
2.46x
10-yr hold
IRR
10.2%
10-yr hold, sold
Yr-1 return on equity
13.1%
CF + paydown + appreciation
Assumptions $612,000 30.0% down 6.5% rate 30-yr loan

Cashflow by Strategy

Monthly net cashflow after all expenses — tap any row to see full assumptions

Long-Term Rental
12+ month lease · most passive
+$273 ▼
Mid-Term Rental
30–90 day furnished · traveling pros
+$2,379 ▼
Short-Term Rental
Airbnb / VRBO · nightly stays
+$2,913 ▼
Section 8 / HUD FMR
Government-guaranteed rent
+$520 ▼
House Hack
Owner-occupant · rent other units
+$1,522 ▼
BRRRR Value-Add
Equity capture on rehab
-$193 ▼
Fix & Flip
One-time resale profit
— ▼

AI Caddie’s Take

AI analysis reflects assumptions at time of last re-analysis. Numbers may differ if assumptions were updated after.

Caddie’s Call

A Berkeley bungalow that pencils as a high-end STR or a house hack; as a plain rental it is a thin bet on appreciation.

Best Strategy

House hack: live in the main floor, rent the finished basement apartment for $1,650 and the numbers turn positive on day one.

Red Flags

Nine days on market in this neighbourhood means multiple offers; expect to go over asking.

Value-Add Opportunity

Separate entrance already exists; permitting the basement as an ADU adds roughly $60K of value.

Market Outlook

Northwest Denver appreciation has outrun the metro for a decade and shows no sign of slowing.
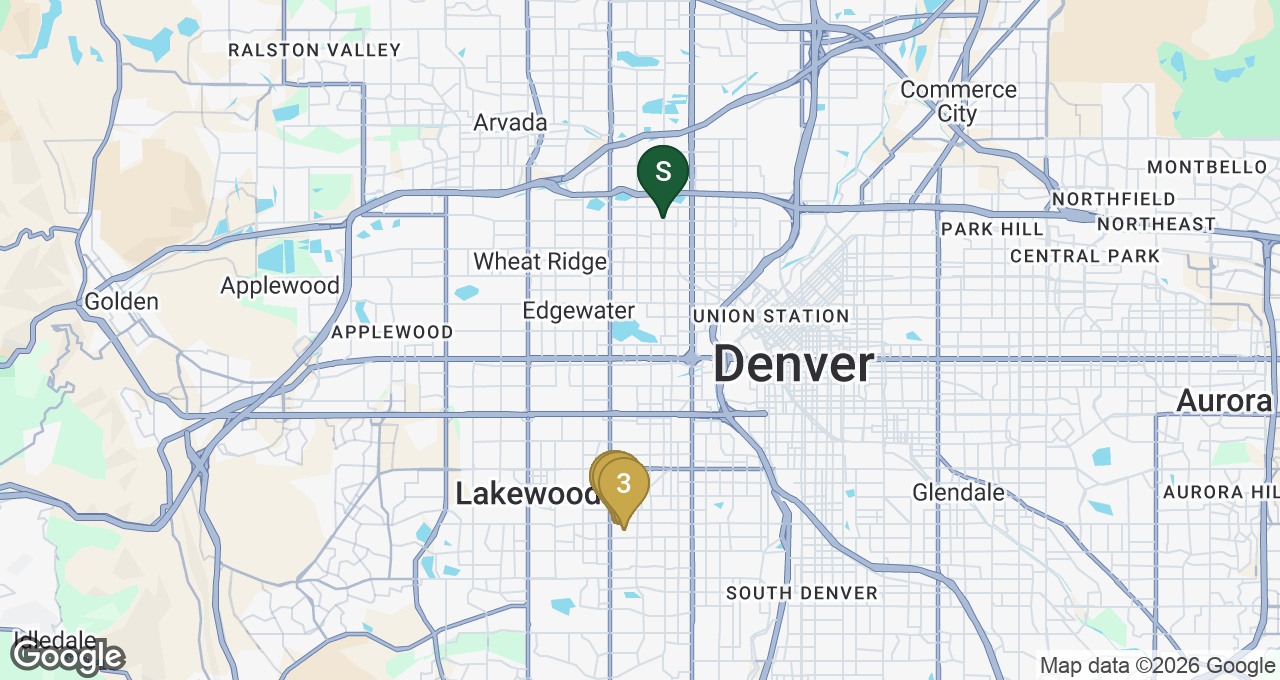
Comparable Sales

Recent sold properties near this address

Comp avg
~$595K
$314/sqft
Asking
$612K
$324/sqft
+3% ▲
Days on market
9 days
Suggested offer
$581K–$603K
$307–$318/sqft
# Recently Sold Bed/Ba Sqft $/Sqft Price Sold vs Avg
1 1130 S Yates St, Denver, CO 80219 ↗ 3/2 · 1,420 sqft · Jul 2026 3/2 1,420 $325 $462,000 Jul 2026
2 1088 S Zenobia St, Denver, CO 80219 ↗ 3/1 · 1,380 sqft · Jun 2026 3/1 1,380 $318 $439,000 Jun 2026
3 1211 S Wolff St, Denver, CO 80219 ↗ 4/2 · 1,690 sqft · May 2026 4/2 1,690 $299 $505,000 May 2026

Comparable sales data captured at time of analysis. Subject property: $324/sqft

Long-Term Investment Projections

3% appreciation · 3% rent growth · 2.5% expense growth · 10-year hold · LTR strategy

Net Proceeds (Yr 10)
$409,947
after 6% selling costs and loan payoff
Annualized ROI
9.4%
on $201,960 invested · vs 7% index fund
Year 1Year 2Year 3Year 5Year 10
Income
Gross rent$52,920$54,508$56,143$59,562$69,049
Vacancy$2,646$2,725$2,807$2,978$3,452
Effective rent$50,274$51,782$53,336$56,584$65,596
Operating expenses
Taxes, insurance & HOA$4,980$5,104$5,232$5,497$6,219
Mgmt, CapEx & maintenance$9,526$9,811$10,106$10,721$12,429
Total operating expenses$14,506$14,916$15,338$16,218$18,648
Net operating income$35,768$36,866$37,998$40,366$46,948
Debt service$32,493$32,493$32,493$32,493$32,493
Cash flow$3,275$4,373$5,505$7,872$14,455
Cumulative cash flow$3,275$7,648$13,153$27,696$86,408
Equity & return
Property value$630,360$649,271$668,749$709,476$822,477
Loan balance$423,612$418,503$413,051$401,029$363,181
Equity$206,748$230,768$255,697$308,446$459,296
Net proceeds if sold$168,927$191,812$215,573$265,878$409,947
Total return on $201,960 invested−$29,758−$2,500$26,765$91,613$294,396
Annualized return-14.7%-0.6%4.2%7.8%9.4%

Year 1 is today's rent and costs. Rent grows from year 2; taxes, insurance, HOA and line items grow at the expense rate; management, CapEx and maintenance stay a % of rent. Sale assumes 6% selling costs; cash invested is the down payment plus closing costs. For illustration only — actual returns will vary.

Jordan Ellis
Jordan Ellis
Investor-Focused Agent · Denver
Front Range Realty Group · Lic. FA.100099123

I work with out-of-state and first-time investors buying rentals along the Front Range. Every property I send comes with the numbers, not a brochure.

3035550110 Email Website →
Prepared by Jordan Ellis · Front Range Realty Group · Powered by DealCaddie.ai