Sample analysis
A real Denver listing, run through DealCaddie on Sep 19, 2026 . This is exactly what you get for any address — your first one is free.
Key Numbers
Long-term rental, at the assumptions below
Monthly costs
$2,327/mo
mortgage, tax, insurance, HOA
Cash to close
$148,170
down payment + closing
DSCR
1.26x
NOI ÷ debt service
Break-even occupancy
81%
to cover costs + mortgage
GRM
10.2x
price ÷ gross annual rent
Rent-to-value
0.82%
the 1% rule
Equity multiple
2.74x
10-yr hold
Yr-1 return on equity
15.6%
CF + paydown + appreciation
Assumptions
$449,000
30.0% down
6.5% rate
30-yr loan
Your scenario — only you see this; it resets when you leave the page.Reset
Financing scenarios
Your own what-ifs, side by side.
+ Add your own
Cashflow by Strategy
Monthly net cashflow after all expenses — tap any row to see full assumptions
Long-Term Rental
12+ month lease · most passive
+$507
▼
Cash-on-Cash Return
4.11%
Mid-Term Rental
30–90 day furnished · traveling pros
+$2,211
▼
Cash-on-Cash Return
17.91%
Cleaning / Turnover
$200.0/turn
Utilities / Internet
$220.0/mo
Short-Term Rental
Airbnb / VRBO · nightly stays
+$734
▼
Avg Daily Rate (ADR)
$249/night
Cash-on-Cash Return
5.94%
CapEx + Maintenance
5.0% + 5.0%
Section 8 / HUD FMR
Government-guaranteed rent
+$715
▼
HUD Fair Market Rent
$3,900/mo
Cash-on-Cash Return
5.79%
CapEx + Maintenance
5.0% + 6.0%
House Hack
Owner-occupant · rent other units
+$224
▼
Total Rental Income
+$3,100/mo
Effective Monthly Cost
+$224
CapEx + Maintenance
5.0% + 5.0%
BRRRR Value-Add
Equity capture on rehab
+$200
▼
After-Repair Value (ARV)
$530,000
Equity captured = ARV − (purchase + rehab + closing costs).
Positive equity means forced appreciation above all-in cost.
Fix & Flip
One-time resale profit
-$26,896
▼
Sale Price (ARV)
$516,000
Net profit = sale price − purchase − rehab − holding − buying & selling closing − agent commission.
AI analysis reflects assumptions at time of last re-analysis. Numbers may differ if assumptions were updated after.
A clean mid-tier rental with real STR upside; the numbers work at asking if you self-manage year one.
Mid-term furnished stays clear the long-term rent by a wide margin here; STR is licensed by right and lands between the two.
1958 build with original galvanized plumbing per the listing photos; budget $8-12K for a re-pipe within three years.
Finish the basement (bath already roughed in) to add a fourth bedroom.
Southwest Denver is flat on price and up about 3% on rents year over year.
Comparable Sales
Recent sold properties near this address
Comp avg
~$475K
$314/sqft
Asking
$449K
$295/sqft
−6% ▼
Days on market
21 days
Suggested offer
$427K–$442K
$280–$290/sqft
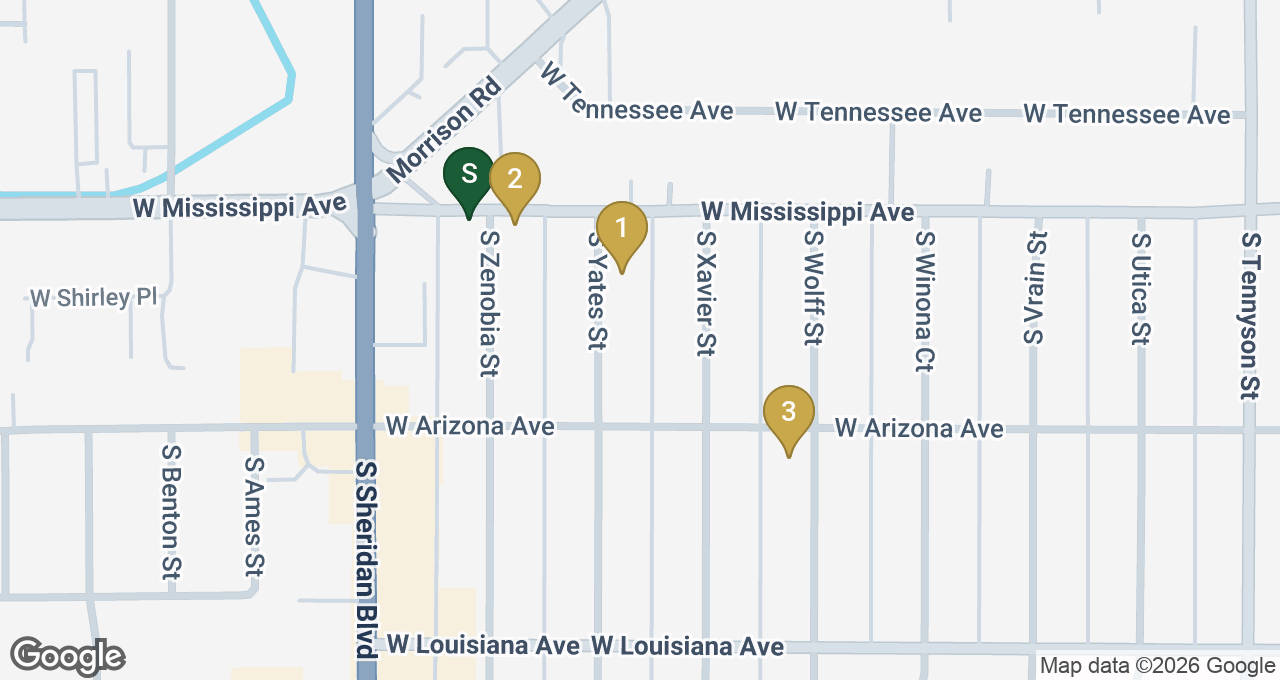
See the comps 3 sold · rent comps · map
Show less
Sold comps
Rent comps
List
Map
#
Recently Sold
Bed/Ba
Sqft
$/Sqft
Price
Sold
vs Avg
1
1130 S Yates St, Denver, CO 80219 ↗
3/2 · 1,420 sqft · Jul 2026
3/2
1,420
$325
$462,000
Jul 2026
2
1088 S Zenobia St, Denver, CO 80219 ↗
3/1 · 1,380 sqft · Jun 2026
3/1
1,380
$318
$439,000
Jun 2026
3
1211 S Wolff St, Denver, CO 80219 ↗
4/2 · 1,690 sqft · May 2026
4/2
1,690
$299
$505,000
May 2026
Comparable sales data captured at time of analysis.
Subject property: $295/sqft
Loading rentals near this address…
3% appreciation · 3% rent growth · 2.5% expense growth · 10-year hold · LTR strategy
Net Proceeds (Yr 10)
$300,762
after 6% selling costs and loan payoff
Annualized ROI
10.6%
on $148,170 invested · vs 7% index fund
Year 1 Year 2 Year 3 Year 5 Year 10
Income Gross rent $44,160 $45,485 $46,849 $49,702 $57,619 Vacancy $2,208 $2,274 $2,342 $2,485 $2,881 Effective rent $41,952 $43,211 $44,507 $47,217 $54,738 Operating expenses Taxes, insurance & HOA $4,080 $4,182 $4,287 $4,504 $5,095 Mgmt, CapEx & maintenance $7,949 $8,187 $8,433 $8,946 $10,371 Total operating expenses $12,029 $12,369 $12,719 $13,450 $15,467 Net operating income $29,923 $30,841 $31,787 $33,767 $39,271 Debt service $23,839 $23,839 $23,839 $23,839 $23,839 Cash flow $6,084 $7,002 $7,948 $9,928 $15,432 Cumulative cash flow $6,084 $13,086 $21,035 $39,886 $105,708 Equity & return Property value $462,470 $476,344 $490,634 $520,514 $603,418 Loan balance $310,787 $307,039 $303,039 $294,219 $266,451 Equity $151,683 $169,305 $187,595 $226,295 $336,967 Net proceeds if sold $123,935 $140,725 $158,157 $195,064 $300,762 Total return on $148,170 invested −$18,151 $5,641 $31,022 $86,780 $258,300 Annualized return -12.3% 1.9% 6.5% 9.7% 10.6%
Year 1 is today's rent and costs. Rent grows from year 2; taxes, insurance, HOA and line items grow at the expense rate; management, CapEx and maintenance stay a % of rent. Sale assumes 6% selling costs; cash invested is the down payment plus closing costs.
For illustration only — actual returns will vary.
Now run the one you’re looking at
DealCaddie runs AI-powered investment analysis on any US property —
deal score, cashflow by strategy, and plain-English insights.
Run yours free →
Free · no card · no sign-up